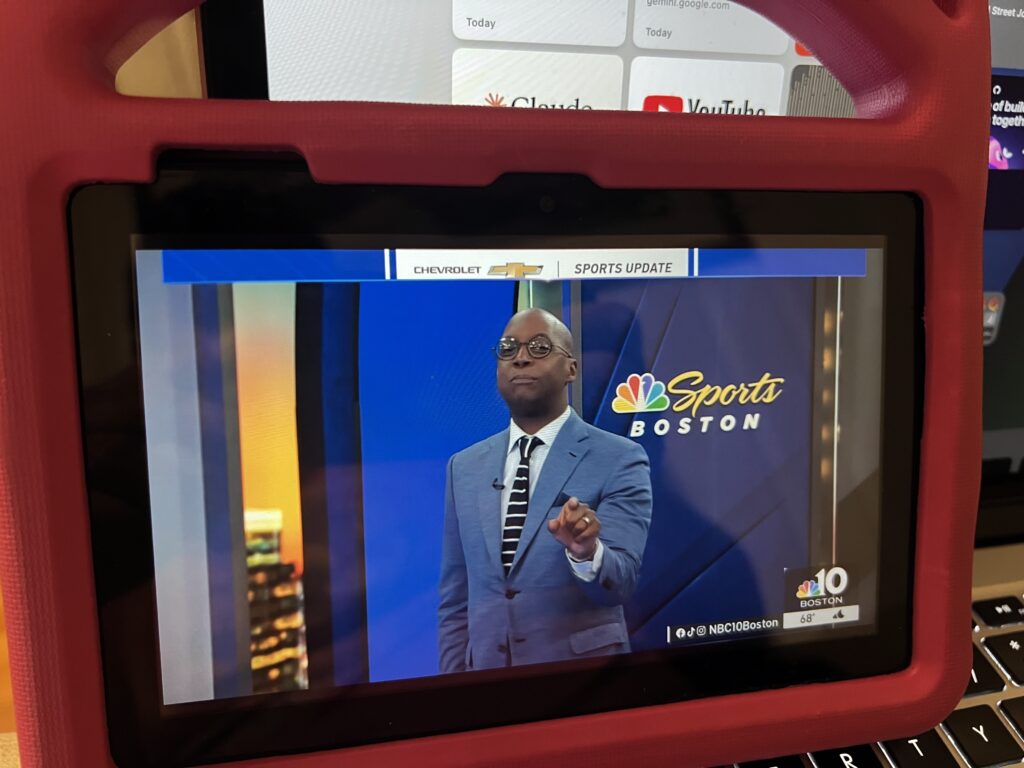
We continue to make good progress on apps that work in the Amazon eco system. The app currently works perfectly on Kindle Fire Tablets. We are still testing it on FireTV boxes. There are a few issues to iron out still but we hope to have it resolve and ready for open beta testing soon. In addition, this will only work on the older fireOS devices not the new VegaOS ones which are completely different.
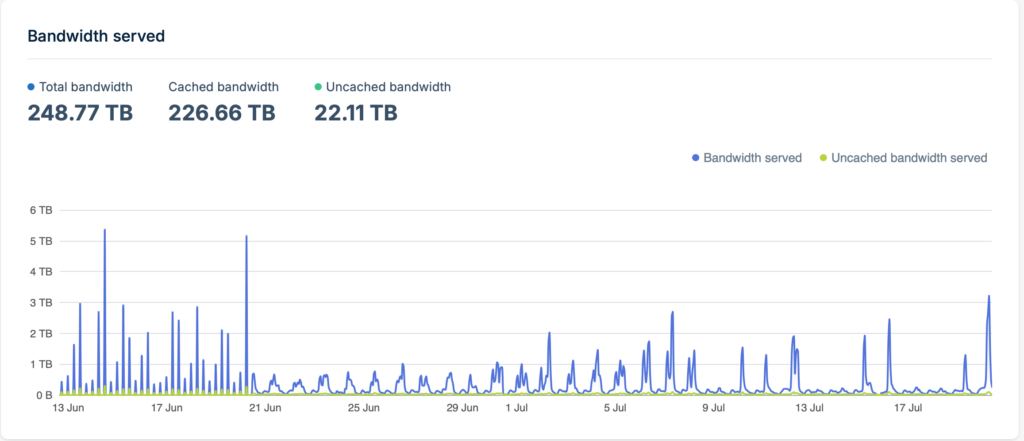
The World Cup was one of the biggest, most prolonged things we have ever streamed. You can see the days and popularity of all the matches in the data that was used. I don’t actually know what changed on June 21. It’s sort of the middle of the round robin stages that ends on June 27, but I see something change on that day in a lot of logs.
There are a lot of changes in the works. We have held off on making changes during the nba playoffs, Stanley cup and World Cup. As a result there have been no updates for a few months now. After the World Cup finals we will release a lot of changes which will come very rapidly. What to expect in the next few weeks
Improved longer guide data
Improved Android client with background audio support, PIP support
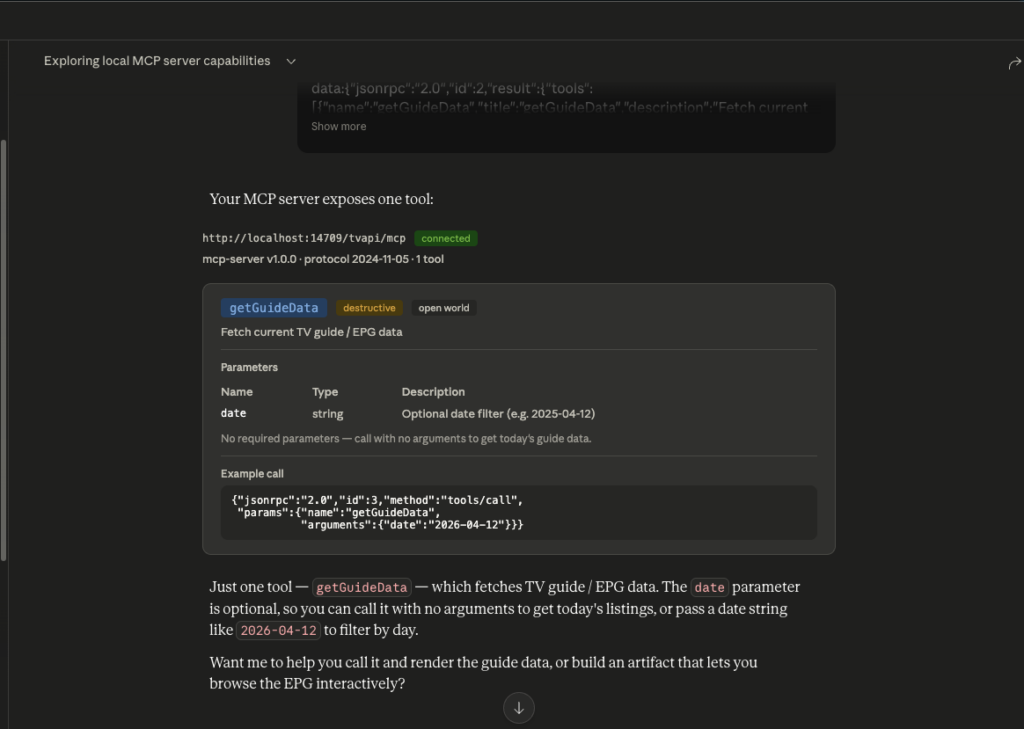
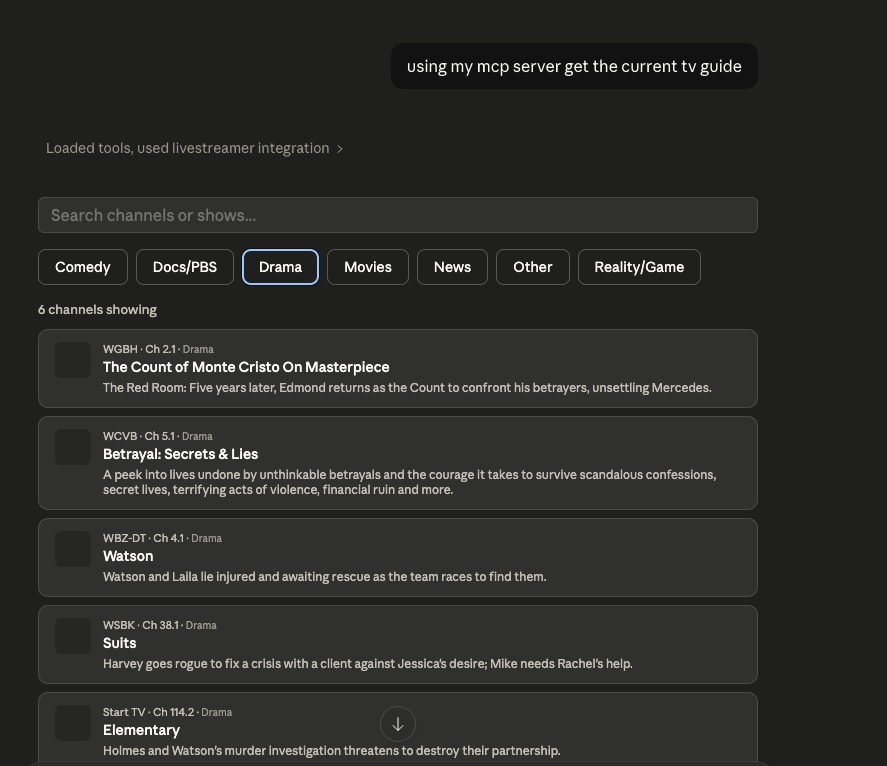
If you follow this blog you are likely aware that AI has been heavily used in the development of LocalTV+. I am currently experimenting with an MCP integration. At the moment it is functional but doesn’t do much it is more of a novelty. Claude (or another AI ) can pull the guide data and you can click through it to see what is on in different genres and see highlights. However, I think some kind of on device agent keeping track of what you like or recommending shows (with the data never leaving your device) could be some thing fun like the old Tivo recommendations that could helped people discover content they wouldn’t ordinarily watch. Something to keep experimenting with for now.
We are rolling out some changes to our clients and server to identify what channels you have access to based on your Designated Market Area (DMA). This will allow us to more accurately identify who we serve and what channels people have access to. This should not matter for most people but if you are on the edges you may find in the future that you no longer see Boston stations. The apps will also show new error messages. If you are outside of the Boston market and see this kind of error and it has the wrong market identified let us know.
As you are likely aware we grew in single a week from a few hundred streams to 30k concurrent streams. While the platform can scale to 30k (or higher!), our primary expense is the cost of bandwidth. We took the time late last week to install some new hardware. The notable component here are (newish) NVIDIA encoders. The newer encoder is a Turing based encoder and we are trying to take advantage of optimizations in the encoder to reduce our cost to serve. At the moment we are switching to using B-frames on most of our encoders. This should in theory reduce our cost to serve these files on the HD channels by up to 30% by making the files that much smaller. In theory this should not come with a reduction in quality but let me know if you notice it. Similarly when applied to the 480i channels (the sub channels) the improvement is far more dramatic, with an 70-80% reduction in file size. While fewer people watch sub channels compared to the HD ones but since the upgrade we have been able to add close to a dozen sub channels, which should give you more content options.
Beyond cost the smaller files of more predictable size should also result in smoother playback overall.
We saw incredible growth at the end of 2025. We went from 10k to 30k users in a week and 43k in 2 weeks. More importantly of those 43k users people actually use the platform more. Especially during football games and other sporting events, the concurrent stream count has gone up to around 30k.
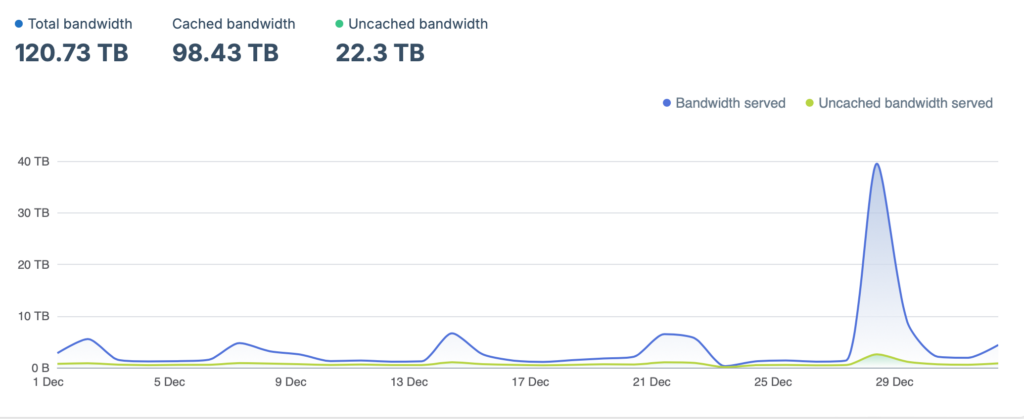
In November we used around $300 in bandwidth. In December we were on track to do the same until the sudden spike for the final patriots games on fox. We pay .05 cents per GB. In December we used 120TB.
120.73 x 1024 GB×0.5 cents/GB=61,813.76 cents
Total Bandwidth Cost: $618.14
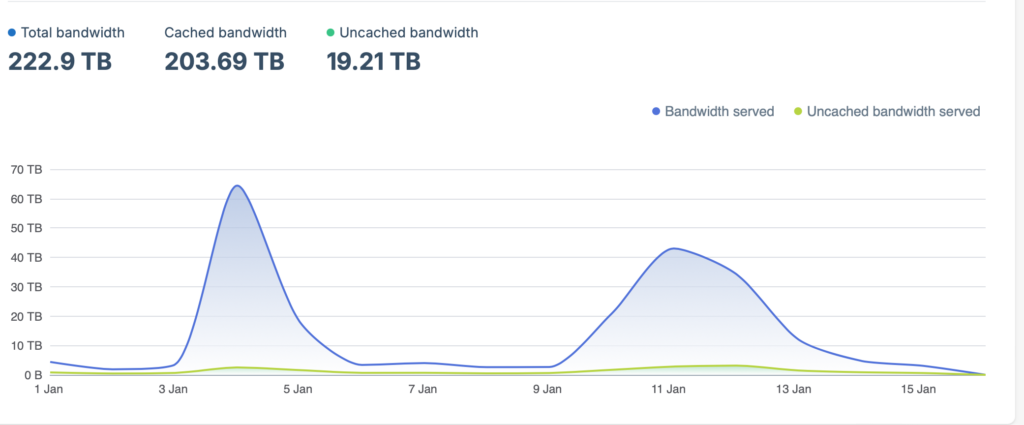
15 Days into January we have smashed those numbers already
222.9 x 1024 GB×0.5 cents/GB=111,450 cents
Total Bandwidth Cost: $1,114.50
Assuming that there isn’t an even bigger spike at the end of the year, I expect the total bandwidth cost for January to be around $2,200.
This 222.9 TB number is interesting. On the localized spikes we have had close to 30k concurrent streams at once. Our streams are 3.5 Mbps when we hit those peaks:
30,000 streams×3.5 Mbps=105,000 Mbps
105,000 Mbps÷1,000=105 Gbps
105Gbps is faster than a lot of networking hardware. I’m impressed we managed to hit that.
With the current user base it will cost us a total of around 30k over the course of the next year. There are a few major sporting events I expect to see spikes, the Winter Olympics and the World Cup are both this year.
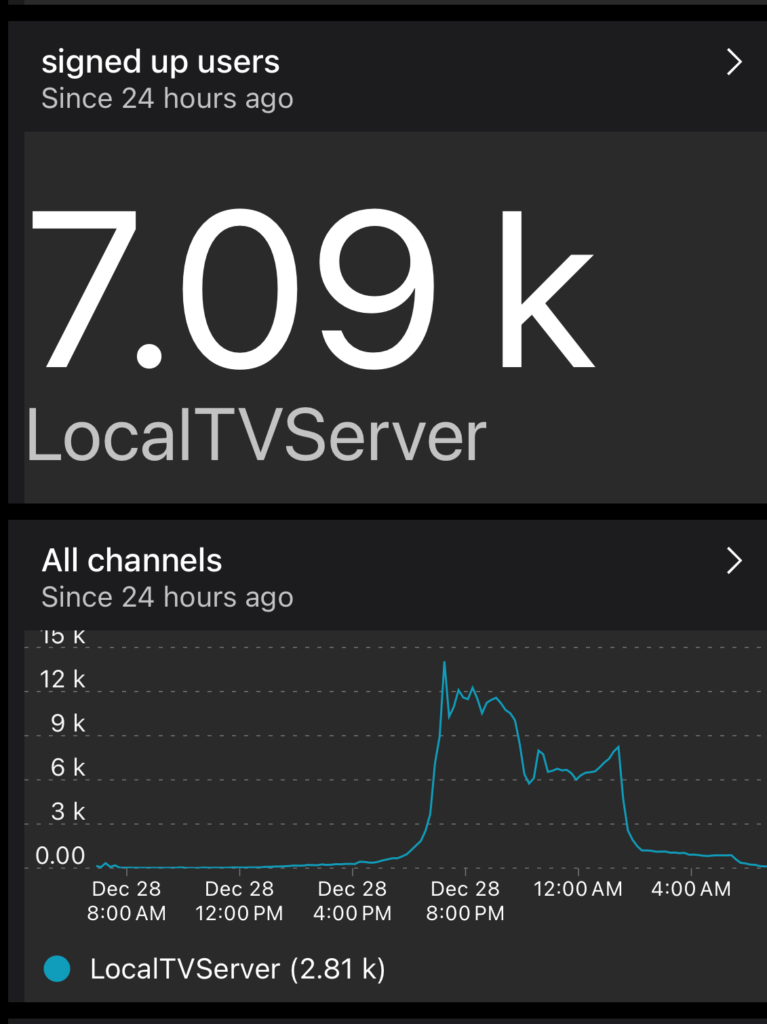
I was traveling in Europe the past couple of weeks. Early on in my travels we experienced a power related hardware failure on our oldest server. The old 2012 Dell desktop that powers most of the service. Thankfully, it was resolved quickly and we have a replacement ready to go for the new year. We had a very brief moment of downtime and I was looking forward to an uneventful end of the year. Unbeknownst to me, the Verizon – Cox dispute was ongoing and it interfered with the ability of people to watch Patriots games on Fox in Boston. Around Dec 27th we were covered in Boston.com . This appears to be the origin of the viral growth. In the 24 hours since this was posted, around 7k people signed up for the service and watched the Patriots game on Fox. In total there were just around 15k users streaming the game on game day.
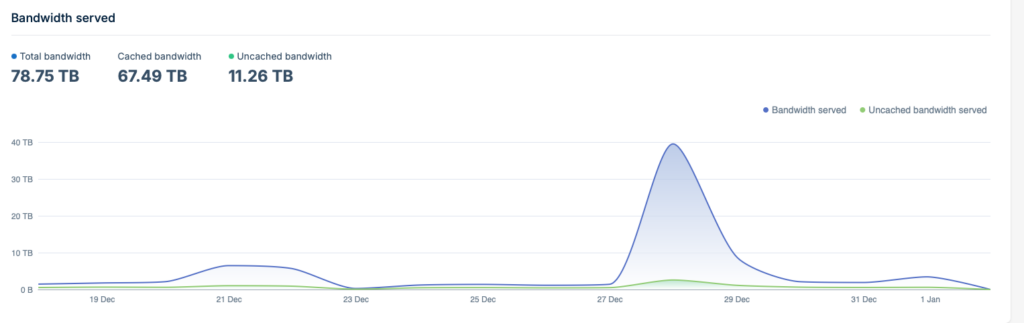
All of the viewers used 40 Tb on data in a night.
New users used to register at the rate of 10-15 a day. We now see about 500 users sign up every day. As of Jan 2, we are at :
24408 users
30,404 devices
Prior to Dec 27 we had a total of 10k users signed up over the previous 2 years. More users signed up in the first 48 hours than the previous two years combined. Prior to this, our busiest day was the Patriots opener at 800 concurrent streams. On December 28th we successfully scaled up to 15k concurrent streams with no increased load on our servers (see green line above).
I like to post updates on Thanksgiving since the disastrous one 2023 was the first time this app was more widely used and we learned so much. Thanksgiving 2024 was much better and it showed how well the app can now scale and adjust to higher traffic levels. In 2025 we have had a much more stable service, iOS and AppleTV versions launched in the app store in January and we have clients on Android devices too. There are now around 11k users using the app and it is able to comfortably handle above 800 concurrent viewers. We’ve upgraded our video hardware to nvidia encoders that are much better. In 2026 we’ll switch to the more modern h265 standard for better video and lower operating costs. We are currently building our new servers that will be located in different locations for higher availability. A general focus for 2026 will be maintaining a more reliable service