Now that we have thousands of testers, this is what a typical NFL game looks like. This is the data usage from Sunday’s games. You may notice that we have also increased the video quality. So far it has been quite successful. We are not seeing many if any buffering/stalling events on the clients. We will continue to improve this. The green line is the hit on our servers. It doesn’t go up very much. The blue is what the CDN absorbs. That can go up until CDN reaches its limits, whatever they are. We pay 0.005 per GB so the 1.34 TB cost us about $6.80 to serve. So far in Sept we are at 9.7 TB total which is about $47 in bandwidth costs.
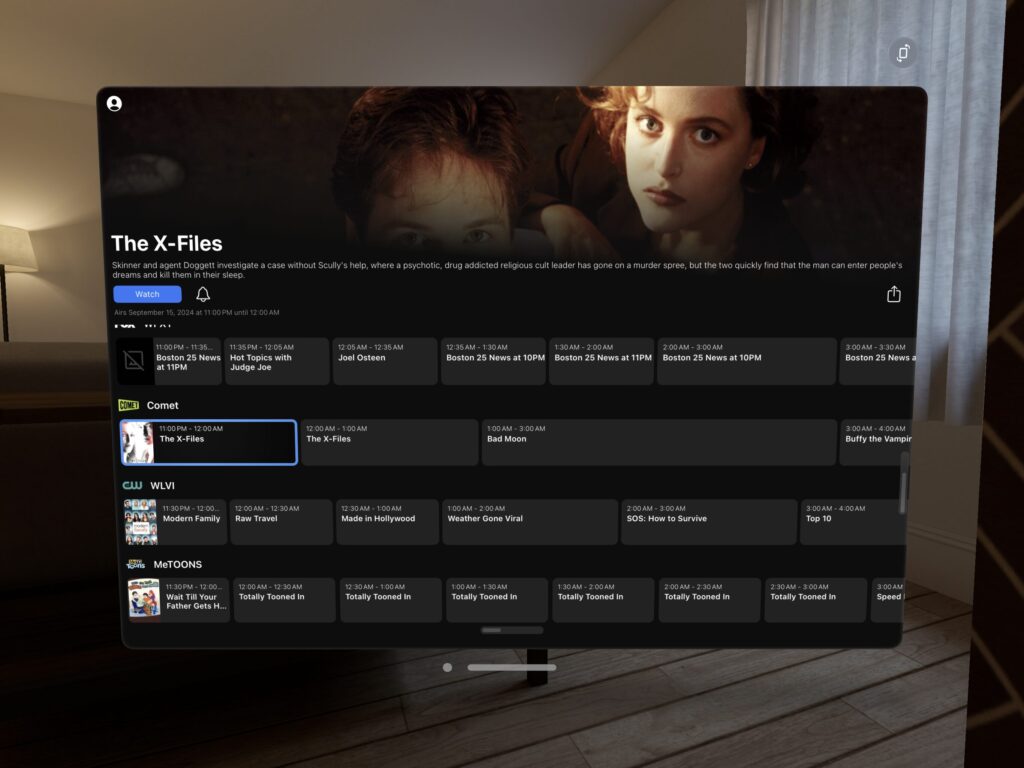
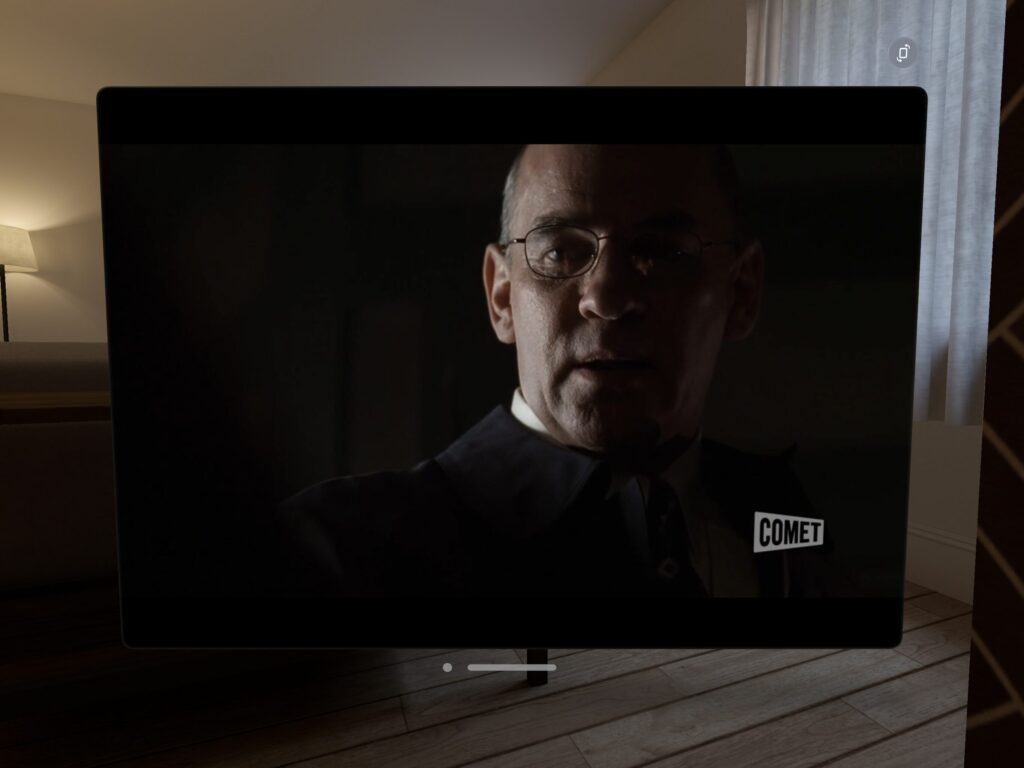
I am enabled Vision Pro support in the latest Testflight build for the iOS app. I do not own a Vision Pro and have only tested it in Apples simulator. It appears to work perfectly fine. If there is anyone out there who has one and tries it out, please let me know how it is for you. Also, yes I am watching CometTV here. This will be arriving in the latest build along with MeTV Toons and WGBX this week.
Looking at our statistics I notice that very few people watch WGBH in this app. It makes sense because there isn’t a lot of reason to watch this stream while PBS provides a high quality free stream themselves. In the interest of focusing on gaps in availability and also supporting broadcasters who make streams available, we will be moving to the official PBS streams linking directly to their app/web page. Everyone still gets to watch the channel for free and it frees up one tuner and one encoder and money that we spend on bandwidth for PBS. All of these are limited resources.
We entered a wider beta at Thanksgiving, midway through the NFL season last year and I immediately collected a lot of ‘data’ about my designs as the service scaled up from 3-4 concurrent users to dozens and everything melted down. After many adjustments I was able to scale up and could handle 65 concurrent viewers for the Super Bowl. We’ve continued to make improvements and I think the quality of the service has visibly improved. Thousands of people watched the NBA post season and the Olympics over the summer.
How many people have signed up recently? The first spike you see is for the NBA finals, the second spike is for the Olympics. There are now around 3000 users.
I measure viewership in streaming minutes. This is how much people are watching a channel. We count one viewer watching for 5 minutes as 1 unit for these graphs. This is what the NBA finals looked like.
Sporting events like the NBA and NFL provide bursts of activity. The olympics were different. Since NBC broadcast everything all day, it was a long term sustained level of traffic unlike anything I’ve seen.
Overall we have been able to handle both one time spikes and also sustained traffic. Looking forward, we will work to reduce stalling as much as possible. We will also switch to a kubernetes cluster that will hopefully allow us to both reduce costs and scale up even more. There is also a plan to add more tuner hardware for metv toons and WGBX.